What Weekly Growth Rate Should an Early Startup Aim For?
Wondering what weekly growth rate an early startup should aim for? Learn the 5 to 7% yardstick, what it means over a year, and how to measure it honestly.
If you are asking what weekly growth rate should an early startup aim for, a common answer is 5 to 7% a week. Paul Graham, who co-founded Y Combinator, wrote in his essay Startup = Growth (September 2012) that a good growth rate during Y Combinator is 5 to 7% a week, that 10% a week is exceptionally good, and that managing only 1% is a sign you have not yet figured out what you are doing. This post shows what those numbers look like over a year, how to measure them, and how to avoid fooling yourself. It is a guide for steering, not a promise that you will hit it.
What weekly growth rate should an early startup aim for?
That range comes from one experienced investor's view of startups in a particular program, so treat it as a useful yardstick and not a law. Graham's advice is to pick a target you think you can hit, and then try to hit it every week. If you hit it, you succeeded that week.
Here is the compounding math, which you can check yourself. At 5% a week, your number doubles about every 14 weeks. At 7%, it doubles about every 10 weeks. Growth that looks small each week becomes large over a year, which is why the target is a weekly percentage and not a flat number of new users.
Why weekly and not monthly? A month is long when you are small. If you only check once a month, you get 12 data points a year. If you check weekly, you get 52. More data points mean you notice a stall in days, not weeks.
Weekly also matches how early work happens. You ship something on Monday, talk to customers on Wednesday, and see the effect by Friday. A weekly number gives you a tight loop between what you did and what changed. A monthly number blurs several experiments into one result.
How to pick the one metric to measure
A growth rate is only useful if it tracks something real. Pick one metric and stick with it for a while. Good candidates depend on your stage:
- Before launch: waitlist signups, or the number of real customer conversations you had.
- After launch, before revenue: weekly active users, meaning people who actually used the product, not people who signed up once.
- With paying customers: weekly revenue, or the number of paying customers.
Graham says the best thing to measure the growth rate of is revenue, and the next best, for startups that are not charging yet, is active users. Avoid vanity numbers such as page views, social followers, or total signups that include people who never came back. If a number can go up while your business gets no healthier, it is the wrong number.
The lesson Growth: The Number a Startup Lives By, in the Business Basics for Builders course on Age of AI Entrepreneur, covers this idea, which is about growth as the number a startup watches. The same course also covers revenue, costs and unit economics, which matter because growth that loses money on every customer is not the kind you want.
What 1%, 5%, and 10% weekly growth looks like over a year
Here is what happens if you start at 100 of whatever you measure and hold a steady weekly rate for 52 weeks. These figures are my own compounding arithmetic, rounded.
- 1% a week: about 168 after a year. That is roughly 1.7 times where you started. Doubling takes close to 70 weeks.
- 5% a week: about 1,260 after a year. That is roughly 12.6 times. Doubling takes about 14 weeks.
- 7% a week: about 3,370 after a year. That is roughly 34 times.
- 10% a week: about 14,200 after a year. That is roughly 142 times. Doubling takes about 7 weeks.
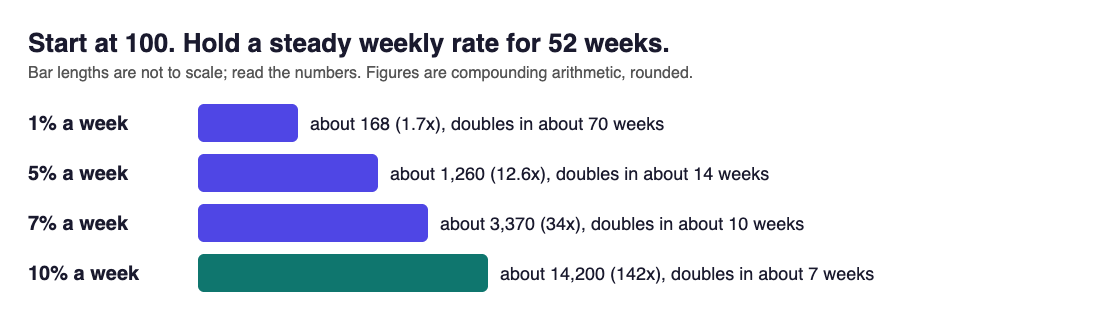
Notice how steep the jump is between 1% and 5%. That gap shows why a small weekly difference matters so much. Also notice that holding 10% for a full year would be very hard. A steady rate gets harder to keep as the number gets bigger, because each week needs a larger absolute gain. Read the list as the shape of compounding, not a forecast.
Growth targets by stage: pre-launch, early traction and after fit
I have no source for exact targets by stage, so here is a way to think about each one instead.
Pre-launch
You may have no users, so a percentage means little. Measure activity you control: customer conversations per week, or waitlist signups from a landing page. Aim for steady week-over-week increases, and focus on whether the people you talk to describe a problem they would pay to fix.
Early traction
This is where a weekly percentage target is most useful. You have a handful to a few hundred users, and you are trying to find what brings in more of them. Pick a rate in the 5 to 7% range, run one or two experiments a week, and watch the single metric.
After product-market fit
Once customers keep coming back and tell others, growth often comes from more than one source. The percentage may drop as the base gets larger, even while the absolute numbers rise. A falling percentage on a bigger base is normal. A falling number in absolute terms is the warning sign.
Why small numbers inflate percentages and how to avoid fooling yourself
Going from 2 users to 3 is 50% growth. Going from 3 to 4 is 33%. These are real percentages and almost meaningless. At very small sizes, one friend signing up swings the rate wildly.
Here are ways to keep yourself honest:
- Use a rolling average. Average the last four weeks instead of reacting to one week.
- Look at the raw count next to the percentage. Say "up 40%, from 5 to 7" so you remember how small the base is.
- Remove friends and family. If your mother and two coworkers make up half your signups, they are not evidence of demand.
- Separate one-off spikes. A post that went viral once is not a growth rate. Ask whether it can repeat.
- Check retention. If new users arrive but leave within days, the rate is flattering you.
The same habit applies to customer feedback. The lesson Talking to Customers Without Fooling Yourself in the Finding AI Opportunities course covers how to test ideas without hearing only what you hope to hear.
How AI-powered startups can hit weekly growth targets faster
AI does not raise your growth rate by itself. What it can do is shorten the time between an idea and a test. If one experiment used to take two weeks to build, and now takes two days, you can run more experiments per month. More experiments give you more chances to find something that works.
Age of AI Entrepreneur has a course built around this, called Your First Builds: Simple Projects. It walks through three starter projects, from no code to a little code:
- A landing page and a waitlist, to test demand before you build anything.
- A prompt-powered micro tool, to give early users something useful.
- An automated workflow, to remove one boring task from your week.
Here is a worked example. Say you want to grow a waitlist by 5% a week. This week you have 120 signups, so the target is 126. You write a plain landing page that names one problem in one sentence, post it where those customers already gather, and ask five people from the waitlist what they hoped to solve. Next week you change the headline based on what they said. You log the result either way. That loop, run weekly, is the whole method.
Be careful about one thing. If your product is only a thin layer over a model that anyone can call, fast early growth can disappear just as fast. This post on thin wrappers explains how to check whether you are building something durable.
What to do when you miss your weekly growth target
You will miss it. Most weeks, early on, the number is noisy. A miss is information, not a failure. Work through these questions in order:
- Was it noise? Compare against your four-week average. One soft week on a small base often means nothing.
- Did something break? Check that sign up, payment, and email flows still work.
- Did you ship anything? If you ran no experiments, a flat week is expected.
- Is the problem acquisition or retention? If people arrive but do not return, more traffic will not fix it.
- Is the target wrong? If you chased a vanity metric, change the metric, not just the effort.
Pick one change for next week and write down what you expect it to do. Then compare.
Frequently asked questions
What is a good weekly growth rate for an early startup?
Paul Graham of Y Combinator wrote that 5 to 7% a week is a good growth rate during YC, and 10% exceptionally good. Treat it as a steering target on one chosen metric, not a guarantee or a pass-fail test.
Should I measure growth weekly or monthly?
Weekly, while you are early. It gives you 52 data points a year instead of 12, and it ties results closely to the experiments you ran that week.
Can AI help me grow faster?
It can shorten how long it takes to build and test an idea, so you can run more experiments. It does not set your growth rate, and it gives no guarantee of results.
Get started
You can learn the basics of growth, unit economics, and early builds in short lessons, each taking 8 to 12 minutes. The blog has more posts like this one, and the About page explains who builds the app.
Every lesson is free. Start learning with Age of AI Entrepreneur: sign in on the home page and take your first short lesson today.